PyChart
As an avid listener of the Talk Python To Me podcast, I was always amazed by how many libraries existed that I had never heard of. The perpetual discovery of these new libraries, which would have made my life so-much-easier last week, provided the motivation for PyChart. Wouldn't it be great if you could see which libraries other people use when they use X.
How it works
First there is a big database of all the public Python repositories available on Github (thanks to ghtorrent.org). For each of the repositories we add a job to an AWS SQS queue. A distributed set of servers (some AWS Spot instances) pick one message at a time from the queue and clone the repository. This repository is then parsed and all the import statements analysed. A JSON encode file containing all the libraries seen with other libraries is created and saved to an AWS S3 bucket before the next message is taken from the queue.
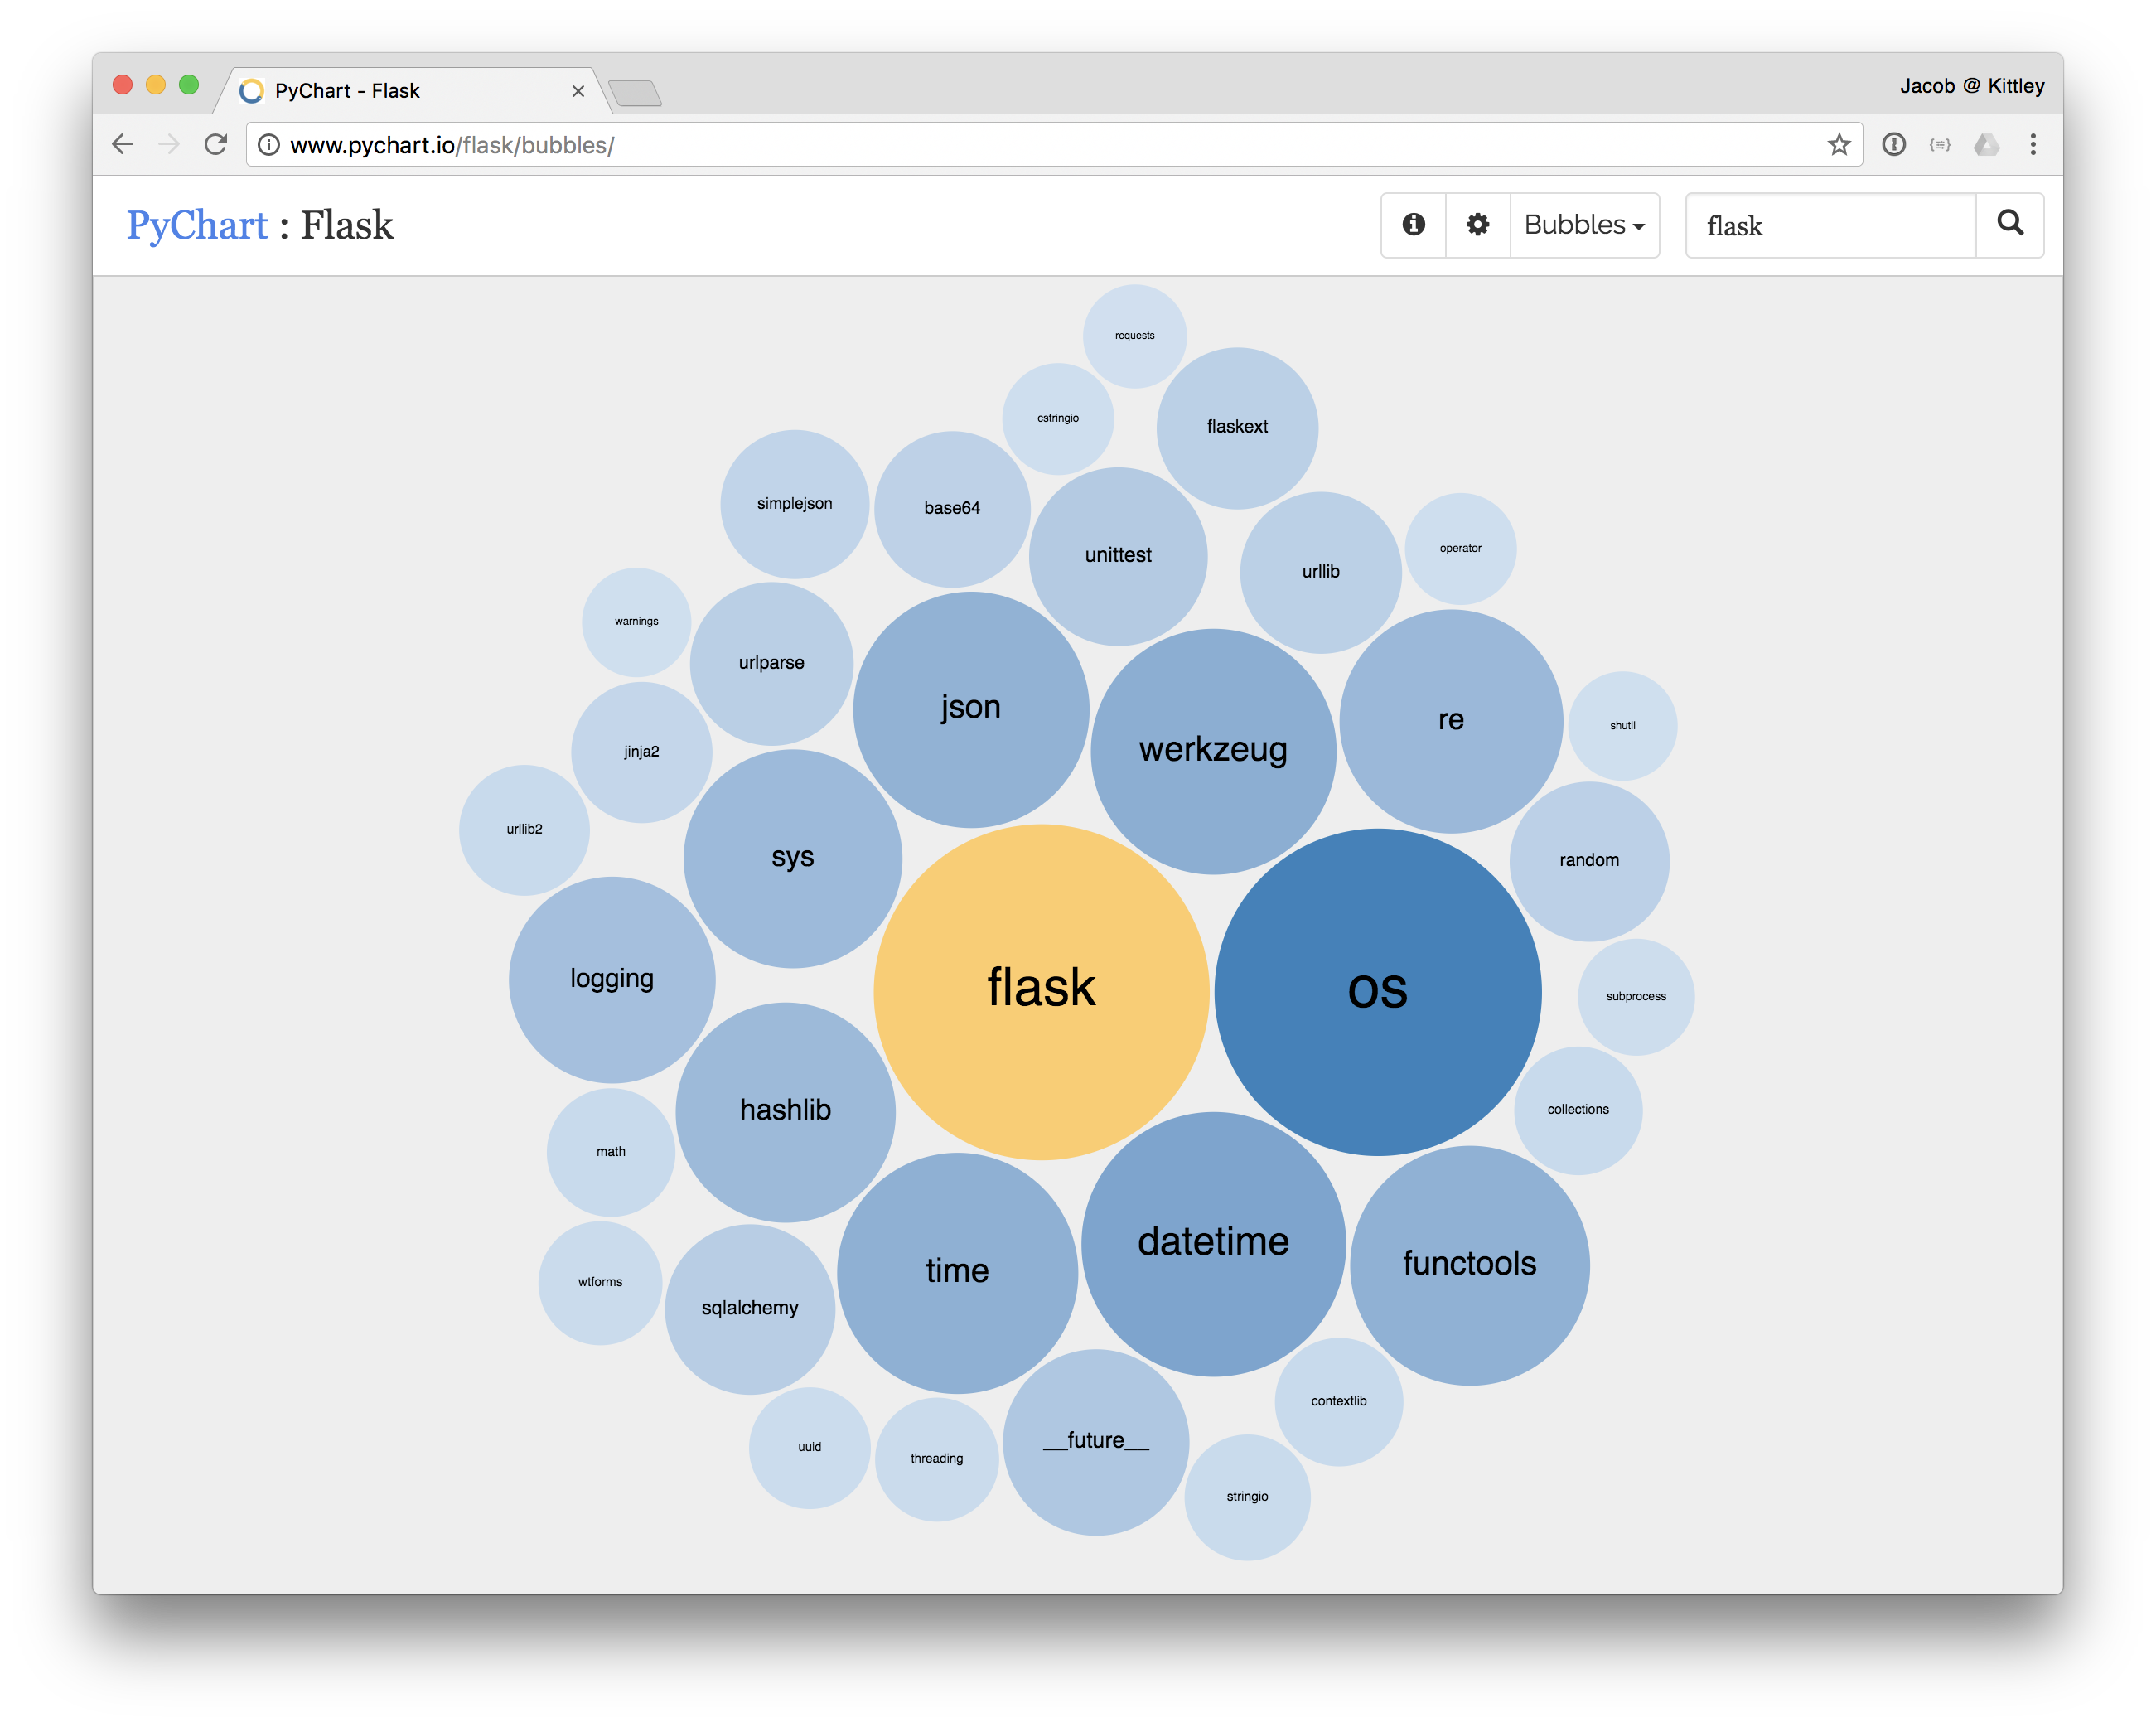
The control server (the one which creates the messages) downloads all the JSON files and updates a graph database (Neo4j). Every Python library is represented as a node and the 'seen with' relationship as an edge. This graph is then analysed to create an individual JSON file for each library (example below). The file holds a list of every other library which the focus library has been seen with and how often. These files are pushed to another AWS S3 bucket from which CloudFront provides CDN access. The PyChart website is hosted on a number of Heroku Dynos which retrieve library information from the CDN.
